
The European Commission has funded extensive research European research projects to investigate pressures and impacts on European surface waters. Two key projects focused on multiple pressure impacts on aquatic life (www.mars-project.eu) and on opportunities to handle chemical pollution comprehensively (www.solutions-project.eu). The results of these projects showed that water quality is affected by spatio-temporally variable combinations of pressures, with a significant role of ambient mixtures (multiple-stress in surface waters). In response, STOWA (English - Foundation for Applied Water Research STOWA | STOWA) has commissioned the development of the Key Factor Toxicity. An important component of that Key Factor is the calculation tool for quantification of the toxic pressure of pollutants and unintended mixtures.
This website offers water quality management professionals, and others, the Key Factor Toxicity calculation tool that assists them in diagnosing chemical pollution threats, so that they can design and implement (cost-)effective programs of measures. The calculation tool is based on mixture toxic pressure assessment. The principles of the calculations are introduced below (see section 1 below).
As a result of the extensive scientific research, STOWA (English - Foundation for Applied Water Research STOWA | STOWA) has commissioned the development of the Key Factor Toxicity.
This website offers water quality management professionals, and others, a calculation tool that assists them in diagnosing chemical pollution threats so that they can design and implement (cost-)effective programs of measures. The calculation tool is based on mixture toxic pressure assessment. The principles of the calculations are introduced below (see section 1 below).
What unintended problems does the Key Factor Toxicity solve
The current principles and practices of the Water Framework Directive appear to cause some serious, but unintended, practical impacts. The current assessment approach appears highly sensitive for extra information on pollution, and highly insensitive to water quality improvement. That is, ambient concentrations are compared to Environmental Quality Standards combined with the use of the ‘one out, all out’-principle, which frequently tag water bodies as ‘red’ (the Quality Standard is exceeded for at least one chemical). Water quality management professionals are, under these circumstances, reluctant to add further compounds to a water quality monitoring scheme. In the same vein, they are hindered in maintaining programs of measures, as those seem to be ineffective (up till the last chemical is not failing the Quality Standard any more). These two unintended effects imply that chemicals present may not be monitored, and that effective measures may stop. The Key Factor Toxicity helps to highlight – i.e., nuance – the degree of pollution, expanding on the WFD-presence of (at least) one pollutant. This helps solving both unintended effects of the Quality Standards-based evaluations.
1. Key Factor Toxicity
The Key Factor Toxicity is used in the context of a water system analysis, to help diagnosing where and due to which compounds and compound groups water quality is affected. The scientific basis for the Key Factor Toxicity is the decades-old observation that the sensitivity of aquatic species to chemical pollutants follows the well-known ‘bell-shaped distribution’ (the so-called ‘normal distribution’). This finding provides the basis to characterize the likelihood that species are affected by chemical pollution, for separate compounds, compound groups and whole mixtures. That likelihood is expressed with the toxic pressure metric. The principles for the calculation tool are introduced here (Section 1). The calculation tool is provided with interpretation guidance (see Sections 2 and 3, respectively).
Scientific principle
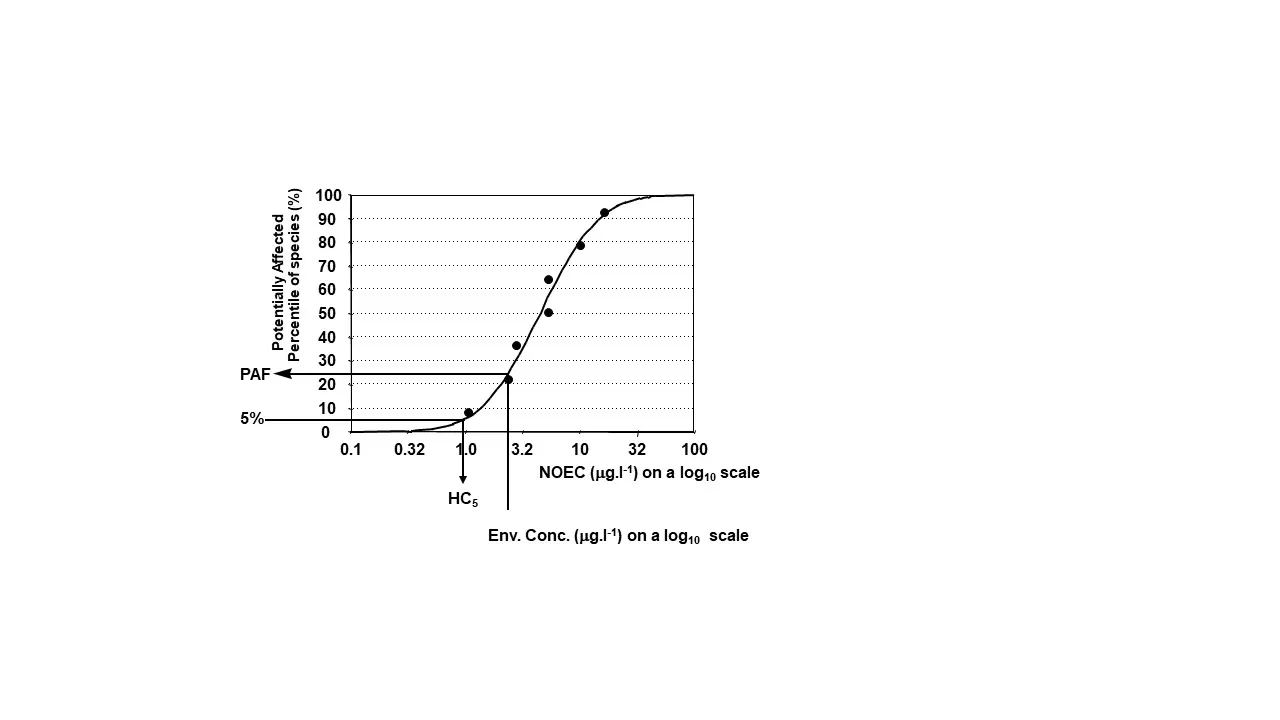
The scientific principle of the toxic pressure assessment is the well-known bell-shaped distribution of sensitivities of aquatic species to a chemical. This distribution takes a S-shaped form when plotted as so-called ‘cumulative distribution’. When a water body is polluted with a chemical, it is easy to enter the concentration on the X-axis and to derive the Potentially Affected Fraction (PAF) of species on the Y-axis. This metric is referred to as the toxic pressure of that chemical pollution level. This approach can be repeated for every chemical monitored in a water body, upon which the PAF-values can be aggregated to a mixture toxic pressure. The unit is then called ‘multi-substance PAF’ (msPAF). The method has been described in a book (https://doi.org/10.1201/9781420032314) and can be applied to many chemicals (https://setac.onlinelibrary.wiley.com/doi/10.1002/etc.4373). Research has shown that an increase of the mixture toxic pressure across a series of water bodies implies an increased limitation to maintaining or restoring a good ecological status (https://rdcu.be/c6h9E). In other words: mixtures matter. Toxic pressure is a metric that expresses the likelihood of impacts, as should be established as described in Annex II of the Water Framework Directive as task of water quality managers.
Utility for water quality assessments
The Key Factor Toxicity provides water quality management professionals with a calculation tool to characterize the toxic pressure levels of compounds, compound groups and whole ambient mixtures. This helps them to do exactly what the Assessment of impacts of the Water Framework Directive asks for: to characterize the likelihood that chemical pollution affects water quality.
The calculation tool helps to interpret the implications of chemical pollution, by translating observed concentrations into terms of damage to aquatic life. This is important to prioritize programs of measures, first by ranking water bodies as to the level of impairment (see toxic pressure maps below), then by ranking chemicals within water bodies as to their relative contribution to the impairment. Neglect of chemical pollutants may imply that programs of measures fail to improve Ecological Status, for example when important chemicals are not considered. Even if all other pressures are successfully mitigated, such unnoticed chemicals may act as limiting factor to recovery to a good status.
The calculation tool has been extensively applied to monitoring data of the whole of the Netherlands. Example results are summarized in the map below. Fill in 'Tox' in the search field. The diagnosis of the role of chemical pollution in affecting aquatic life can be selected for the total ambient mixture (of all monitored compounds, or compound groups), by typing ‘tox’ for the ‘stack’ button (upper left panel), and by selecting between the options for mapping the toxic pressure of separate compound groups.
The diagnosis of the role of chemical pollution in affecting aquatic life can be selected for the ambient mixture (of all monitored compounds, or compound groups), by typing ‘tox’ for the ‘stack’ button (upper left panel), and selecting between the options.
Towards practice
Everybody can create maps of the toxic pressure in a water system by collating measured (or predicted) water concentrations of pollutants, and entering those in the calculation tool. The Key Factor Toxicity provides a calculation tool with which the concentrations of chemical pollutants are expressed in the effect-related metric (msPAF). The calculation tool for deriving the toxic pressure of compounds, compound groups and whole ambient mixtures is provided in Section 2.
Note: Regulatory alignment with the Water Framework Directive
Chemical pollutants are commonly evaluated under the Water Framework Directive by comparing ambient concentrations with the chemical-specific protective Environmental Quality Standards, followed by the application of the “one out, all out” principle. This provides the water quality management professionals with the insight whether there is at least one chemical of concern, or not, which triggers the development of measures to improve water quality, or to maintain the good status, respectively. This method must be used, and provides a first insight in water quality issues with chemicals.
The Key Factor Toxicity adds crucial information to this first step, as it yields nuanced insights for prioritizing measures to those water bodies where pollution impacts are highest, and chemicals contributing most, and helps to identify chemical groups and/or chemicals that contribute most to that for each water body. Efforts have been put into embedding the toxic pressure results in the context of the Water Framework Directive. This resulted in a calibration between the toxic pressure metric and the WFD-Ecological Status classes. The alignment of the evaluation of pollution via Environmental Quality Standards and via the Key Factor Toxicity is detailed in Section 3.
2. Toxic pressure calculation tool
The toxic pressure calculation tool is a web-application that helps to re-calculate concentrations of chemical pollutants in surface waters into toxic pressure units, expressed as Potentially Affected Fraction (PAF) of species for single chemicals, and the multi-substance PAF (msPAF) for unintended ambient mixtures. The toxic pressure calculations are done in such a way that the outcomes relate to both the principles underlying the judgment of water pollution with Environmental Quality Standards as well as the judgement of impacts of multiple pressure on Ecological Status. The interpretation is further explained in section 3.
The in- and output of the calculation tool
The toxic pressure calculation tool converts (monitored or predicted) concentrations of substances into their toxic pressure. This is a metric that expresses the extent to which the concentration has an impeding effect on aquatic life. The calculation principle is similar to aggregating greenhouse gases with respect to climate effects, with methane contributing 28-34 times more to warming effects than carbon dioxide. The toxic pressure of various substances that occur together can also be aggregated in this way.
The application of the calculation tool provides insight into the total toxic pressure of the mixture of measured substances, or of separate substance groups or even separate substances. This insight helps to prioritize measures. The results can be mapped, to summarize spatial patterns in toxicity, and recognize how hydrological connectivity relates to toxic pressure patterns. This can be done for whole mixtures, or specific compound groups. In those ways, the assessor can diagnose sites and compounds for priority management. Toxic pressure data can also be interpreted over time, which can help evaluating whether novel human activities cause increased toxic pressure in surface waters, or whether past programs of measures cause decrease of toxic pressure.
How the calculator works
Data on the local mixture is collected, in the form of:
- Information about place and time,
- Concentrations of substances that occur locally, as representative as possible for the local situation,
- Data on various physico-chemical properties of the water, as these influence the bioavailability
The data is prepared and entered in a form (Excel) that is used by the Dutch authorities to collect water quality data for formal Reporting Water Framework Directive data to the European Commission.
The data that is to be entered always involves assessing a number of locations and/or times in a water system analysis, as the output is most informative for management when considering the water system as a broader unit. The data is read in, and any input errors, or substances for which no toxicity data exist, are listed. After correcting optional errors, the toxic pressure results are calculated.
The results are exported to Excel. The scientific output is presented as numerical values, whereby the PAF-values for each compound always range between 0 and 1 (no- or all species potentially affected). The same holds for the mixture toxic pressure (which is logical, because no more than 100% of the species can be affected). The calculations are performed using two types of information on sensitivity, whereby one focuses on the interpretation in line with the Environmental Quality Standards context, and the other with the Ecological Status impact context. Those scientific outputs are aggregated into a colour scheme, as explained in Section 3.
The scientific output (numbers) can be edited by the assessor, for example for summary on a map of toxic pressure readings. Differences between locations (on the map), or between substance groups (one is more important than the other), or over time (the toxic pressure drops or rises) inform users about measures and their prioritization according to place and substance group. Or they show deterioration of water quality (with new human activities) or progress (with effective measures).
Using the tool
The use of the tool consists, stepwise, of:
1. Collating input data in a pre-defined format. A standardized format in Excel is provided here below (download button)
2. Running the tool via the web-interface (see below)
3. Interpretation of the results (see Interpretation page URL)
4. Presentation of the results, in any desired format (map, table, etc.)
5. Prioritization of measures, by ranking sites and then compounds and compound groups within sites
The principles of the calculation tool and the steps that are made for a calculation are explained in the Guidance document, which you can download here, together with the standardized format for the input data (concentrations of identified chemicals per sample):
The Toxic Pressure Calculation tool is available here (choose “English” in the selection menu for the English-language version of the tool):
3. Toxic pressure interpretation
The toxic pressure calculations relate to the judgment of water pollution with Environmental Quality Standards as well as to the judgement of impacts of multiple pressure on Ecological Status. The interpretation is facilitated by a color-coded system of chemical pollution classes, with definitions aligned with both the Chemical- and the Ecological status approaches and principles of the Water Framework Directive.
The chemical pollution classification
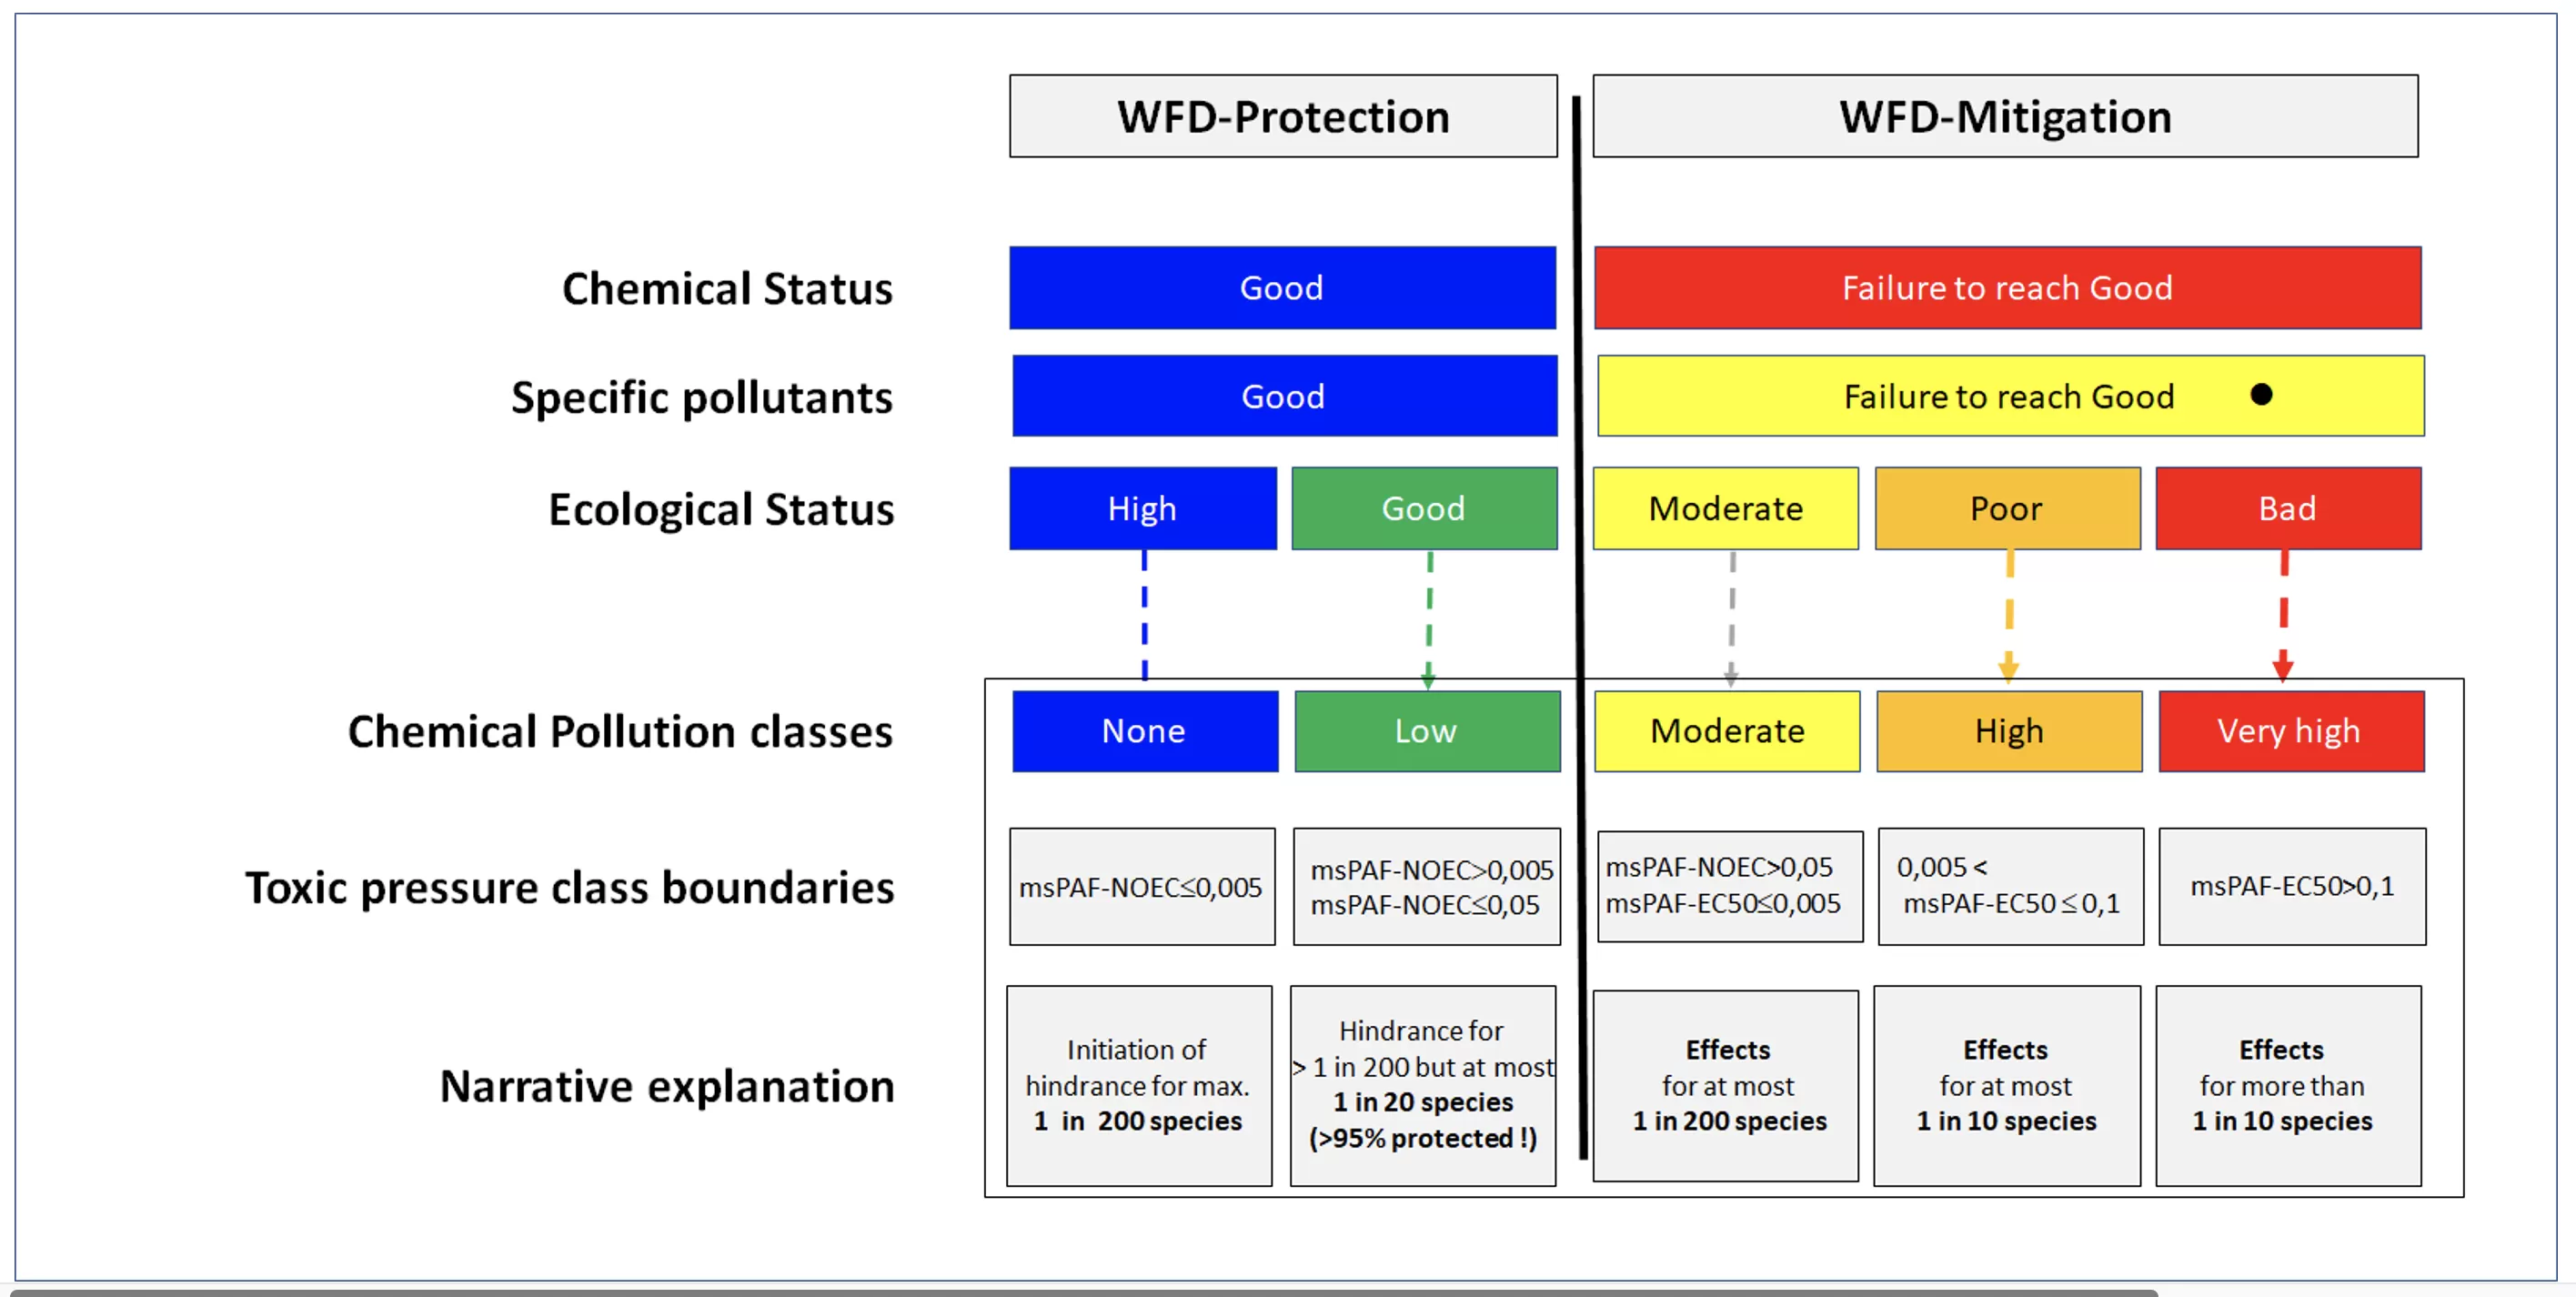
The outputs of the Key Factor Toxicity calculation tool are summarized in Chemical Pollution classes. Those have been developed with an eye on both the Chemical policies of the European Union as well as on the Ecological Status classification of the Water Framework Directive. The basis for the scheme is provided by the WFD and by calibration research, whereby toxic pressure data for many sites are calibrated to ecological impact data.
The resulting scheme is shown, and the basis for designating the classes is explained below. For ease of interpretation, the classes are explicitly explained in the Water Framework Directive context of establishing the likelihood of damage, that is: in terms of e.g. “less than 1 in 20 species” being affected.
Alignment with Environmental Quality Standard principles
Environmental Quality Standards play a key role in water quality protection, assessment and management, as they help to identify whether a water body is sufficiently protected (concentration lower than the protective Standard), or not. In the former case, the water manager can consider measures to maintain the protected status, else measures should be taken to restore water quality until the concentration drops below the Standard. The Standards are based on extensive scientific research into the effects of chemical pollution on human health and aquatic life, by both direct exposures or via secondary poisoning, so that sufficient protection indeed means protection of all these three exposure-effect routes. In practice, this means that the Standard is defined for the most sensitive of them. For aquatic life, the Standard has its roots in the concept of ‘95%-protection level’, which is the exposure level where 95% of the species is not exposed beyond their No Observed Effect Concentration (NOEC). The chemical pollution classes of the Key Factor Toxicity are based on this same principle, that is:
- The least polluted class is referred to as ‘None’ polluted. The class boundaries are msPAF-NOEC=0 (lower) and msPAF-NOEC<0.005 (upper). The latter metric expressed that, at most, 1 in 200 species might be exposed at the No Observed Effect Level. The class boundary is operationally chosen.
- The next class is referred to as ‘Low’ polluted and has the aforementioned 95%-protection level as upper boundary, that is: msPAF-NOEC<0.05. For this class, the msPAF-NOEC calculations did not yield zero or very low values, but the exposure level is such that there is still no violation of the 95%-protection level, which defines the class boundary of Chemical Safety Assessment policies. The latter metric expressed that, at most, 1 in 20 species might be exposed at the No Observed Effect Level.
Technically, these two Chemical Pollution classes are thus designated on the basis of msPAF-NOEC output data, with a chosen inter-class boundary.
Alignment with Ecological Status damage principles
The Ecological Status of water bodies plays a key role in water quality protection, assessment and management, as it defines water quality classes on the aspect of absence or presence – more specifically: presence and degree – of damage. If damage is found, the water quality management professional must diagnose its cause, and take remedial action. It is conceptually logical to try to calibrate the mixture toxic pressure metric to these classes, because then a chemical pollution classification system (based on msPAF-metrics) is congruent with the Ecological Status classification system. In other words, chemical pollution can then be managed in full alignment with the ecological impacts of other pressures. Such calibration studies have been done. They showed that increased mixture toxic pressure implies increased limitation to maintain or restore the ecological status (Chemical pollution imposes limitations to the ecological status of European surface waters | Scientific Reports (nature.com)).
The chemical pollution classes of the Key Factor Toxicity are based on this same principle, that is:
- The third class is referred to as Moderately polluted, as the aforementioned 95%-protection level boundary has been exceeded (msPAF>0.05) whilst damage to the Ecological Status is relatively limited. For this class, the msPAF-EC50 calculations suggest that effects (at the EC50-level) occur in at most 1 in 200 species.
- The fourth class is referred to as Highly polluted, on the basis of an increase of the msPAF-EC50 outcomes. For this class the msPAF-EC50 calculations suggest that effects (at the EC50-level) occur in more than 1 in 200 species but less than 1 in 20 species
- The fifth class is referred to as Very highly polluted, on the basis of a further increase of the msPAF-EC50 outcomes. For this class the msPAF-EC50 calculations suggest that effects (at the EC50-level) occur in more than 1 in 20 species.
Technically, these classes are thus designated mainly on the basis of msPAF-EC50 output data.